Halloween is ‘Deadliest Day’ Of The Year For Child Pedestrian Fatalities State Farm
Two Decades of Data Reveal Risks Beyond the Candy
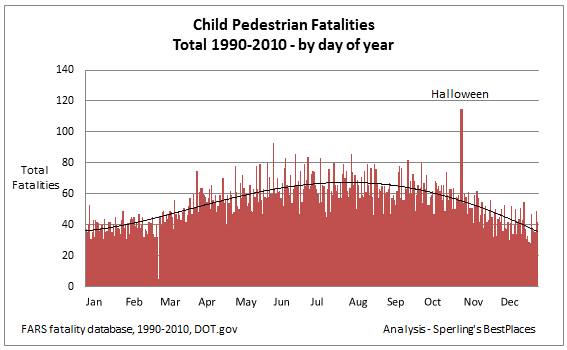
Kids have a greater chance of being fatally injured by a car on Halloween than any other day of the year, including the Fourth of July and New Year’s Day. State Farm®, the nation’s leading auto insurer, teamed up with research expert, Bert Sperling of Sperling’s BestPlaces, to better understand the risk kids face as they take to the streets in search of treats.
Sperling’s BestPlaces analyzed more than four million records in the Fatality Analysis Reporting System (FARS) from 1990 – 2010 for children 0-18 years of age on October 31. A description of the methodology follows the graphs below.
That detailed analysis revealed the following:
-
Halloween Was Deadliest Day of the Year for Child Pedestrian Accidents
One hundred and fifteen child pedestrian fatalities occurred on Halloween over the 21 years of our analysis. That is an average of 5.5 fatalities each year on October 31, which is more than double the average number of 2.6 fatalities for other days.
-
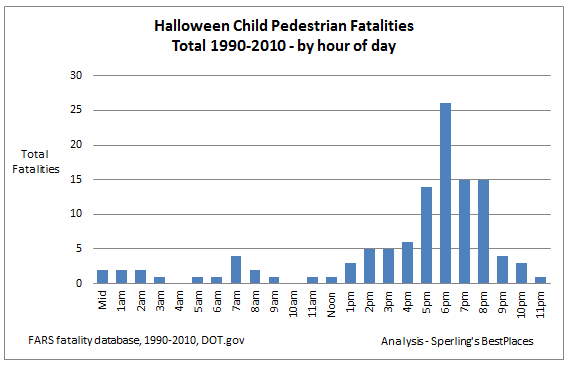
The “Deadliest Hour”
Nearly one-fourth (26 out of 115) of accidents occurred from 6:00 – 7:00 p.m. Over 60% of the accidents occurred in the 4-hour period from 5:00 to 9:00 p.m.
-
Middle of the Block Most Hazardous
Over 70% of the accidents occurred away from an intersection or crosswalk.
-
Ages Most at Risk on Halloween
Most of the fatalities occurred with children ages 12-15 (32% of all child fatalities), followed by children ages 5-8 (23%).
-
Drivers Who Posed the Greatest Risk
Young drivers ages 15-25 accounted for nearly one-third of all fatal accidents involving child pedestrians on Halloween.
-
Drivers Who Posed the Lowest Risk
Drivers ages 36-40 and 61-65 were involved in the fewest child pedestrian fatalities on Halloween. Together, these age groups accounted for nine child pedestrian fatalities (8%) in the 21 years of the study.
-
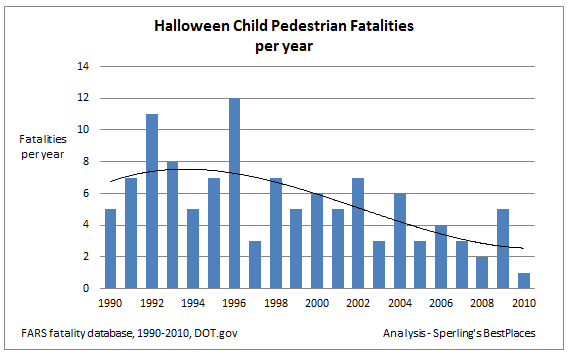
Fatalities Declining
Each of the last six years of the study (2005 – 2010) has seen Halloween child fatalities below the 21 year average of 5.5.
“State Farm wants children to be safe every day of the year whether they are inside or outside of a car,” says Kellie Clapper, assistant vice president of Public Affairs at State Farm. “The analysis of this data highlights the particular need for parents to be especially alert during Halloween.”
State Farm and Sperling’s BestPlaces encourage responsible driving every day of the year, and especially this Halloween as costumed children fill the streets. If you must drive, avoid all distractions, turn off the radio, put down the smart phone, and be alert for the unexpected. Fully engaged drivers can make 2012 the year of zero child pedestrian fatalities. (For additional child safety information, visit http://st8.fm/safekid.)
Researchers,
Bert Sperling
Piper Smith
Methodology
All accidents in the FARS systems for the most recent 21 years (1990 to 2010) were analyzed. We examined over four million records during that period, tallying the number of pedestrian incidents (including bicycles, tricycles, and other conveyances) for children 0-18 years of age, on the day of October 31st.
The source of our data for the analysis was the Fatality Analysis Reporting System (FARS). FARS is a data system conceived, designed, and developed by the National Center for Statistics and Analysis (NCSA) to assist the traffic safety community in identifying traffic safety problems and evaluating both motor vehicle safety standards and highway safety initiatives.
Fatality information derived from FARS includes motor vehicle traffic crashes that result in the death of an occupant of a vehicle or a nonmotorist within 30 days of the crash. FARS contains data on all fatal traffic crashes within the 50 states, the District of Columbia, and Puerto Rico.
To access the low-level FARS data for our analysis, we processed and analyzed Vehicle and Driver accident records for the years 1990-2010.
The FARS database provides the day, month, and year of each incident, as well as the time of day, location of individuals involved, their ages, and the severity of their injuries (including death).
Sperling’s BestPlaces