Pain at the Pump
Which Cities Hurt the Most
May 18, 2006
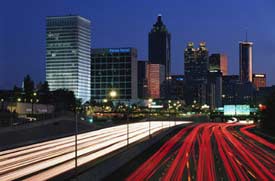 Evening commute in Atlanta
With the price of gasoline at a new high in the U.S., spending $50 for a tank of gas is no longer uncommon. These high fuel prices are putting a serious dent in the pocketbooks of American motorists, and industry analysts are saying that these high prices may be here to stay, at least for the foreseeable future.
We're all feeing the pain at the pump, but some cities are getting hit worse than others since they depend more on the automobile for transportation. So how does your home town stack up?
The city experts at Sperling's BestPlaces not only looked at the cost of a gallon of regular-grade gasoline in 80 major U.S. cities, but also analyzed the number of miles driven by daily commuters, plus the effect of rush-hour congestion. What they found was that Atlanta commuters can spend over $5,700 annually on gas, for a family which includes two daily drivers, earning it the title of the most expensive city for driving.
Where does your city rank? See the entire list of 80 metro areas.
The list of the top ten most expensive places for driving is:
|
Rank |
Metro Area |
Annual cost |
Gal. per day |
|
1. |
Atlanta, GA |
$5,772 |
3.3 gal. |
|
2. |
Birmingham, AL |
$5,464 |
3.2 |
|
3. |
Orlando, FL |
$5,404 |
3.0 |
|
4. |
Jacksonville, FL |
$5,360 |
3.0 |
|
5. |
Pensacola, FL |
$5,173 |
2.9 |
|
6. |
Raleigh-Durham, NC |
$5,066 |
2.8 |
|
7. |
Nashville, TN |
$5,033 |
2.9 |
|
8. |
Los Angeles,, CA |
$4,890 |
2.3 |
|
9. |
Cape Coral, FL |
$4,890 |
2.6 |
|
10. |
San Diego, CA |
$4,739 |
2.2 |
(based on a family of two daily commuters, gas prices 5/09/06)
Sprawl = Pain
"The large cities of the South and Midwest landed in the top ten due to their sprawling development," according to Bert Sperling, president of Sperling's BestPlaces, a Portland, Oregon research firm which specializes in studies about city livability. "That sprawl requires the typical commuter in those cities traveled over 60 miles each day (round trip)."
In the California cities of Los Angeles and San Diego, the average daily commute was only about 45 miles, but some of the nation's highest gas prices pushed them into the top ten. Visit Sperling's BestPlaces web site (https://www.bestplaces.net/docs/studies/gasstudy.aspx) for the complete rankings and additional information about the study.
The list of the top ten least expensive places for driving is:
|
Rank |
Metro Area |
Annual cost |
Gal. per day |
|
1. |
El Paso, TX-NM |
$2,736 |
1.6 gal. |
|
2. |
Anchorage, AK |
$2,760 |
1.5 |
|
3. |
Boulder, CO |
$2,839 |
1.6 |
|
4. |
Eugene, OR |
$2,965 |
1.5 |
|
5. |
Salem, OR |
$2,972 |
1.6 |
|
6. |
Spokane, WA |
$3,125 |
1.7 |
|
7. |
Charleston, SC |
$3,215 |
1.9 |
|
8. |
Omaha, NE-IA |
$3,259 |
1.9 |
|
9. |
Honolulu, HI |
$3,291 |
1.6 |
|
10. |
Cleveland, OH |
$3,301 |
1.9 |
(based on a family of two daily commuters, gas prices 5/09/06)
The least expensive cities for driving all had one thing in common; the average commute was much shorter than the most expensive cities — around 30 miles per day.
Net Effect on a Family's Finances
Next, Sperling's decided to dig a little deeper, to see how today's high gas prices affected the typical family's bottom line. By comparing the cost of gas with each metro area's after-tax family income, they found that a two-commuter family in Birmingham now spends over 13% of its after-tax income just on gasoline. And that's just gasoline — it doesn't include the cost of buying the cars, maintaining them, or paying for insurance. Other top places where gas takes the largest share of a family's income include Pensacola, Orlando, Jacksonville (FL), and Atlanta.
"The rising fuel prices have placed an incredible burden on families which were already living very close to the edge," said Sperling. "And often, they have no choice but to keep driving - and paying. They've got to go where their jobs are."
Events on a Collision Course
In his work of tracking and measuring city liveability, Sperling has noticed two current events which are on a collision course.
"Due to rising home prices, families have been fleeing the inner suburbs and moving far beyond the city limits in order to find affordable housing in a family-friendly environment. The cost is a commute of two hours, or more."
"But now this lengthy commute is suddenly much more expensive. People are trying to cut down on their driving, but few are lucky enough to have their workplace close to their home."
Two Predictions to Watch
"As gas prices stay high, we foresee a couple of new trends developing," predicts Sperling. "First, teleworking (also known as telecommuting) will become more common in the near future. All the pieces are in place (broadband internet access and laptop computers) for this practice to become widely accepted. Trials have shown that employee productivity and job satisfaction have actually increased with teleworking, and it's tough to beat that 30-second commute."
For Sperling's recent study of cities which will see the most benefit from teleworking, "Best Cities for Teleworking."
"The other, longer-range, trend will be a move away from sprawling cities and suburbs that are dependent on cars. Business workplaces will start to move where the employees are, instead of the other way around. Employers that can boast a five-minute commute will have their pick of the best and brightest workers. Small towns that disappeared in the unrestricted growth of the last 70 years will reappear as a new local economy coalesces around these city centers. In way, the new urban landscape will start to resemble that of a hundred years ago, before the impact of the automobile and inexpensive transportation."
"Some of these changes may happen surprisingly quickly," notes Sperling. "Our study shows that the high gas prices are having a major impact on a family's finances, and they may be ready to make a dramatic change to adapt."
Methodology
This study uses measures of gas usage and economy, such as the average number of miles drivers travel in each city and the average number of gallons each driver uses and wastes in traffic congestion each day. It was assumed that a typical family had two wage-earners, each commuting in separate vehicles. The total of federal and state tax rates varied from 35% to 42%, depending on the family's income. Statistics were derived from the following studies; 2005 Urban Mobility Study by Texas Transportation Institute, the American Automobile Association (AAA) Fuel Gauge Report, 2005 Fuel Economy data from the U.S. Environmental Protection Agency (EPA), the Tax Foundation, and the U.S. Census Bureau American Community Survey.